As Universal Analytics is set to come to a halt midway through 2023, being able to track our social campaigns and keep them intact and optimised is crucial. While GA4 does set out to provide more data and granularity than Universal Analytics, there can be a few more steps involved than we are otherwise used to in finding the data we need. This guide will take you through the necessary steps to track and view campaign data and then customise your report for the metrics specific to your campaign.
How Does GA4 Differentiate Between Paid and Organic Social?
In Universal Analytics, paid social and organic social were, by default, combined into one category called social, which made it harder to differentiate between the two. You could only see the difference by adjusting the default channel grouping and changing the parameters. Luckily in GA4, they have us covered. By default, GA4 now separates the two, which can be found in your traffic acquisition report.
Traffic Acquisition Report
- Under the ‘Reports’ Tab
- Select the ‘Acquisitions’ drop-down on the left-hand side
- Click ‘Traffic acquisitions.’

Although GA4 does automatically differentiate between the two channels, there is a set of criteria that we, as users, need to follow in order for it to track correctly this includes;
- For organic social, the source has to match a list of the social networks ‘OR’ the medium has to match any of the following: (“social”, “social-network”, “social-media”, “sm”, “social network”, “social media”)
- For Paid search, the source has to again match a social network ‘AND’ the medium has to match (“cpc”, “ppc”, “paid”)
Viewing Campaign Performance
By selecting the default channel grouping drop down above the table, you can also view the data split down by campaign, source, medium and platform.
Once you’ve split the data by source/medium, you can add a secondary dimension by hitting the ‘+’ button. To view a particular campaign, from the drop-down menu, go to ‘Traffic Source’, then select ‘Session Campaign’; you will then be able to view all the campaigns you have running.

Customising the Report Specific to Your Needs
Customising the report in universal analytics was pretty simple – fortunately, in GA4, it’s still reasonably straightforward, but there are a couple more steps involved.
If you click on Customise report, which is the pencil icon in the top right corner, click on ‘Metrics’ then ‘Add metric’. This will then give you a list of loads of possible metrics to add to the report, such as bounce rate, returning users, session duration, views etc.
How to View Only Paid Social
After you’ve split the report down by source and medium, the table can still be a little messy, with the data from all the channels still visible. To narrow this down so you can only see traffic from paid social involves a few more steps.
Firstly, click on ‘All Users’ at the top of the report, which will then open up a column on the right-hand side.
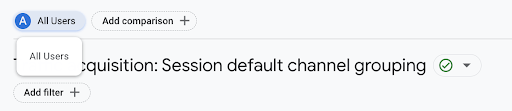
Change the dimension to ‘Session default channel grouping’ and the dimension value to ‘Paid Social’, click apply, then you will now only see data from paid social channels.
Now You’re Set!
Hopefully, by using one of the above methods, you will have been able to find the data you’re looking for within GA4. If you are still unsure about GA4 or need help setting it up or accessing certain reports, give us a call to speak to one of our specialists!